Description
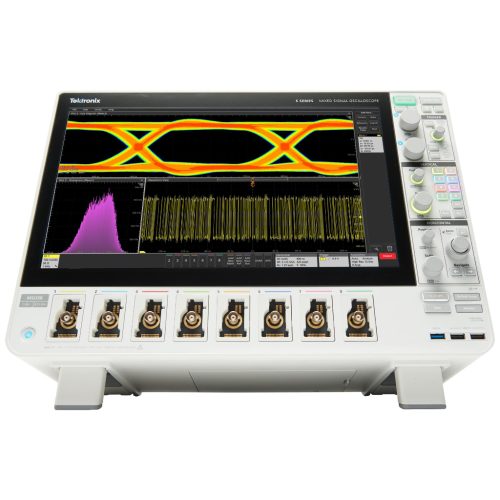
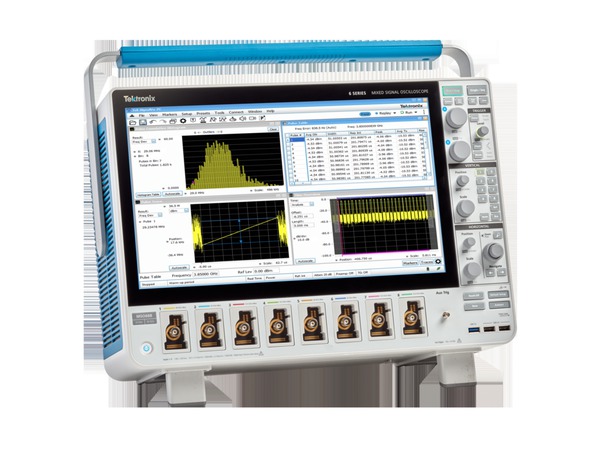
With the lowest input noise and up to 10 GHz analog bandwidth, the 6 Series MSO provides the best signal fidelity for analyzing and debugging today’s embedded systems with GHz clock and bus speeds. The remarkably innovative pinch-swipe-zoom touchscreen user interface coupled with the industry’s largest high definition display and up to 8 FlexChannel®inputs that let you measure one analog or eight digital signals per channel, the 6 Series MSO is ready for today’s toughest challenges and tomorrow’s too.
Never let a lack of channels slow down your verification and debug process again
The 6 Series MSO offers better visibility into complex systems by offering four, six and eight-channel models with a large 15.6-inch high-definition (1,920 x 1,080) display. Many applications, such as embedded systems, three-phase power electronics, automotive electronics, power supply design, and Power Integrity require the observation of more than four analog signals to verify and characterize device performance and to debug challenging system issues.
Most engineers can recall situations in which they were debugging a particularly difficult problem and wanted greater system visibility and context, but the oscilloscope they were using was limited to two or four analog channels. Using a second oscilloscope involves significant effort to align the trigger points, difficulty in determining the timing relationships across the two displays, and documentation challenges.
You might assume that a six and eight-channel oscilloscope would cost 50% or 100% more than a four-channel oscilloscope, you’ll be pleasantly surprised to find that six-channel models are only ~25% more than four channel models and eight-channel models are only ~67% (or less) more than four channel models. The additional analog channels can pay for themselves quickly by enabling you to keep current and future projects on schedule.
FlexChannel®technology enables maximum flexibility and broader system visibility
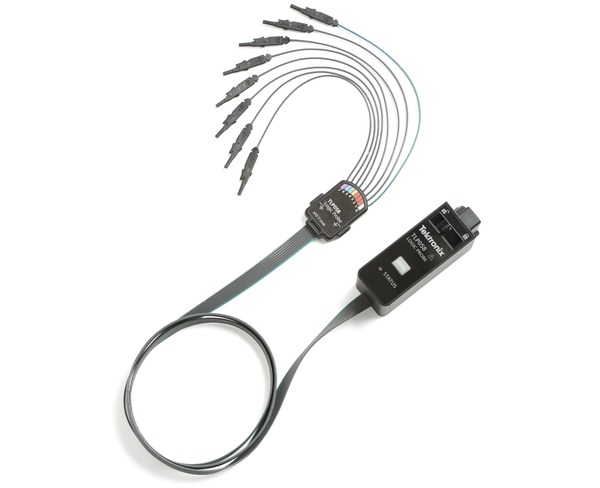
The 6 Series MSO redefines what a Mixed Signal Oscilloscope (MSO) should be. FlexChannel technology enables each channel input to be used as a single analog channel, eight digital logic inputs (with the TLP058 logic probe), or simultaneous analog and spectrum views with independent acquisition controls for each domain. Imagine the flexibility and configurability this provides.
You can change the configuration at any time by simply adding or removing TLP058 logic probes, so you always have the right number of digital channels.
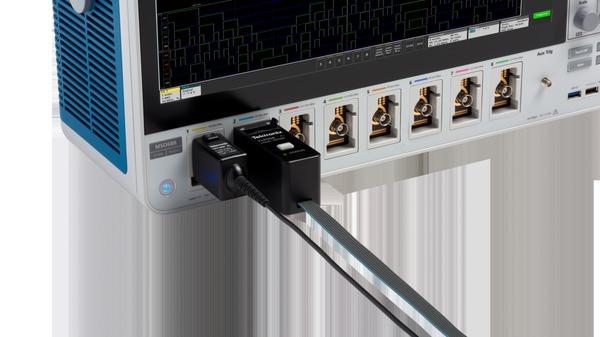
Previous-generation MSOs required tradeoffs, with digital channels having lower sample rates or shorter record lengths than analog channels. The 6 Series MSO offers a new level of integration of digital channels. Digital channels share the same high sample rate (up to 50 GS/s), and long record length (up to 1Gpoints) as analog channels.
Unprecedented signal viewing capability
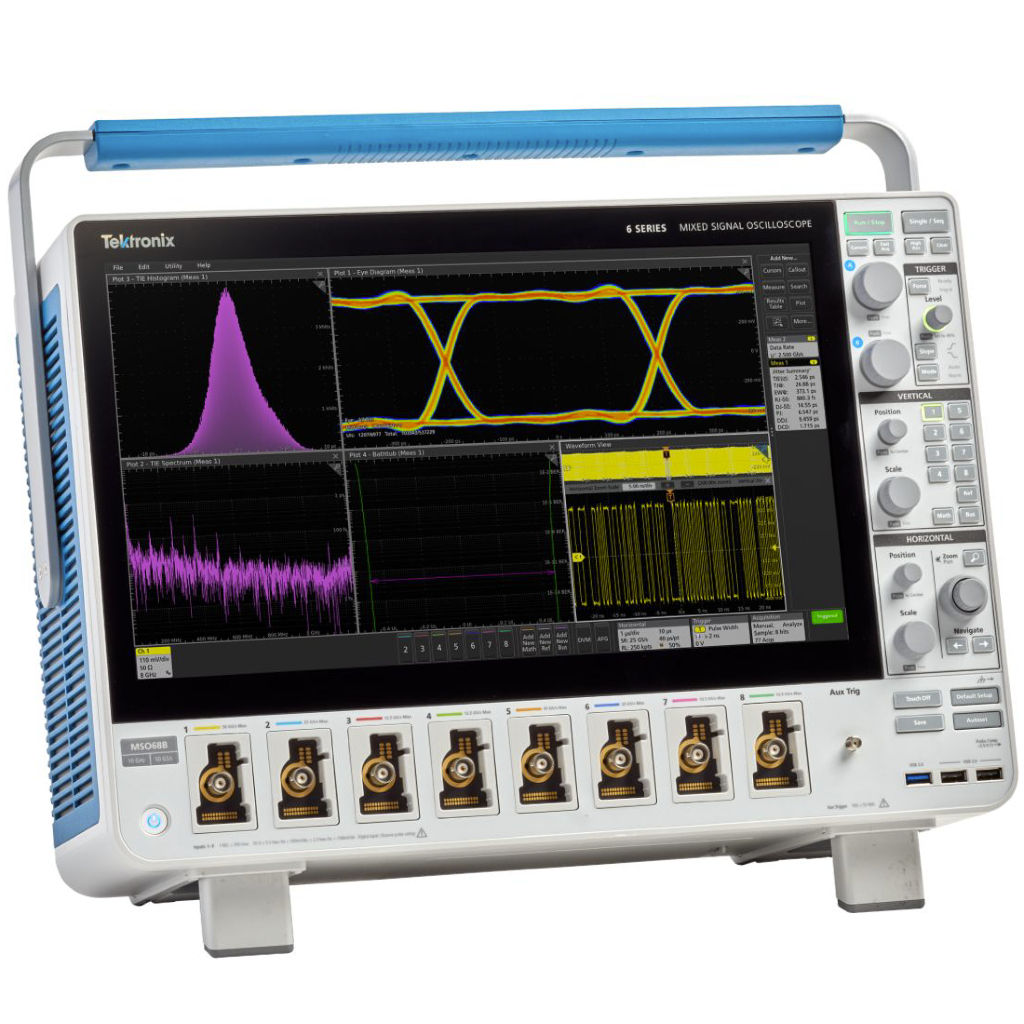
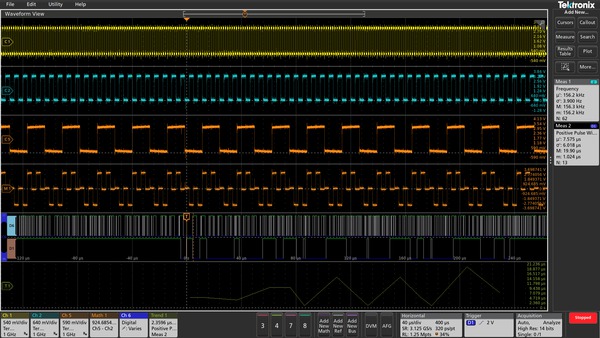
The stunning 15.6″ (396 mm) display in the 6 Series MSO is the largest display in the industry. It is also the highest resolution display, with full HD resolution (1,920 x 1,080), enabling you to see many signals at once with ample room for critical readouts and analysis.
The viewing area is optimized to ensure that the maximum vertical space is available for waveforms. The Results Bar on the right can be hidden, enabling the waveform view to use the full width of the display.
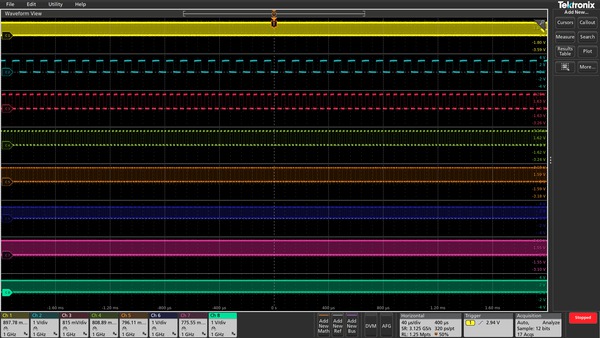
The 6 Series MSO offers a revolutionary new Stacked display mode. Historically, scopes have overlaid all waveforms in the same graticule, forcing difficult tradeoffs:
- To make each waveform visible, you vertically scale and position each waveform so that they don’t overlap. Each waveform uses a small percentage of the available ADC range, leading to less accurate measurements.
- For measurement accuracy, you vertically scale and position each waveform to cover the entire display. The waveforms overlap each other, making it hard to distinguish signal details on individual waveforms
The new Stacked display eliminates this tradeoff. It automatically adds and removes additional horizontal waveform ‘slices’ (additional graticules) as waveforms are created and removed. Each slice represents the full ADC range for the waveform. All waveforms are visually separated from each other while still using the full ADC range, enabling maximum visibility and accuracy. And it’s all done automatically as waveforms are added or removed! Channels can easily be reordered in stacked display mode by dragging and dropping the channel and waveform badges in the Settings bar at the bottom of the display. Groups of channels can also be overlaid within a slice to simplify visual comparison of signals.
The massive display in the 6 Series MSO also provides plenty of viewing area not only for signals, but also for plots, measurement results tables, bus decode tables and more. You can easily resize and relocate the various views to suit your application.
Exceptionally easy-to-use user interface lets you focus on the task at hand
The Settings Bar – key parameters and waveform management
Waveform and scope operating parameters are displayed in a series of “badges” in the Settings Bar that runs along the bottom of the display. The Settings Bar provides Immediate access for the most common waveform management tasks. With a single tap, you can:
- Turn on channels
- Add math waveforms
- Add reference waveforms
- Add bus waveforms
- Enable the optional integrated Arbitrary/Function generator (AFG)
- Enable the optional integrated digital voltmeter (DVM)
The Results Bar – analysis and measurements
The Results Bar on the right side of the display includes immediate, one-tap access to the most common analytical tools such as cursors, measurements, searches, measurement and bus decode results tables, plots, and callouts.
DVM, measurement and search results badges are displayed in the Results Bar without sacrificing any waveform viewing area. For additional waveform viewing area, the Results Bar can be dismissed and brought back at any time.
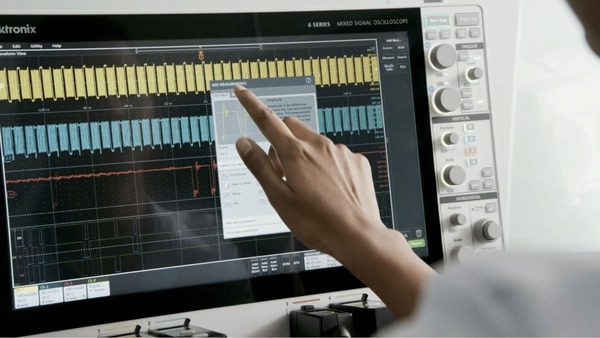
Touch interaction finally done right
Scopes have included touch screens for years, but the touch interface has been an afterthought. The 6 Series MSO’s 15.6″ display includes a capacitive touchscreen and provides the industry’s first oscilloscope user interface truly designed for touch.
The touch interactions that you use with phones and tablets, and expect in a touch enabled device, are supported in the 6 Series MSO.
- Drag waveforms left/right or up/down to adjust horizontal and vertical position or to pan a zoomed view
- Pinch and expand to change scale or zoom in/out in either horizontal or vertical directions
- Flick items off the edge of the screen to delete them
- Swipe in from the right to reveal the Results Bar or down from the top to access the menus in the upper left corner of the display
Smooth, responsive front panel controls allow you to make adjustments with familiar knobs and buttons, and you can add a mouse or keyboard as a third interaction method.
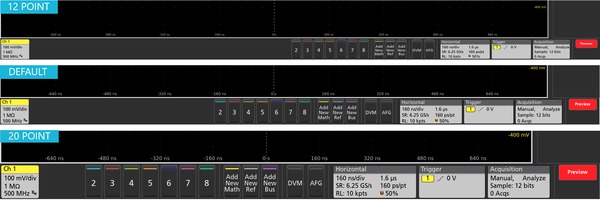
Variable font size
Historically, oscilloscope user interfaces have been designed with fixed font sizes to optimize viewing of waveforms and readouts. This implementation is fine if all users have the same viewing preferences, but they don’t. Users spend a significant amount of time staring at screens, and Tektronix recognizes this. The 6 Series MSO offers a user preference for variable font sizes; scaling down to 12 points or up to 20 points. As you adjust the font size, the user interface dynamically scales so you can easily choose the best size for your application.
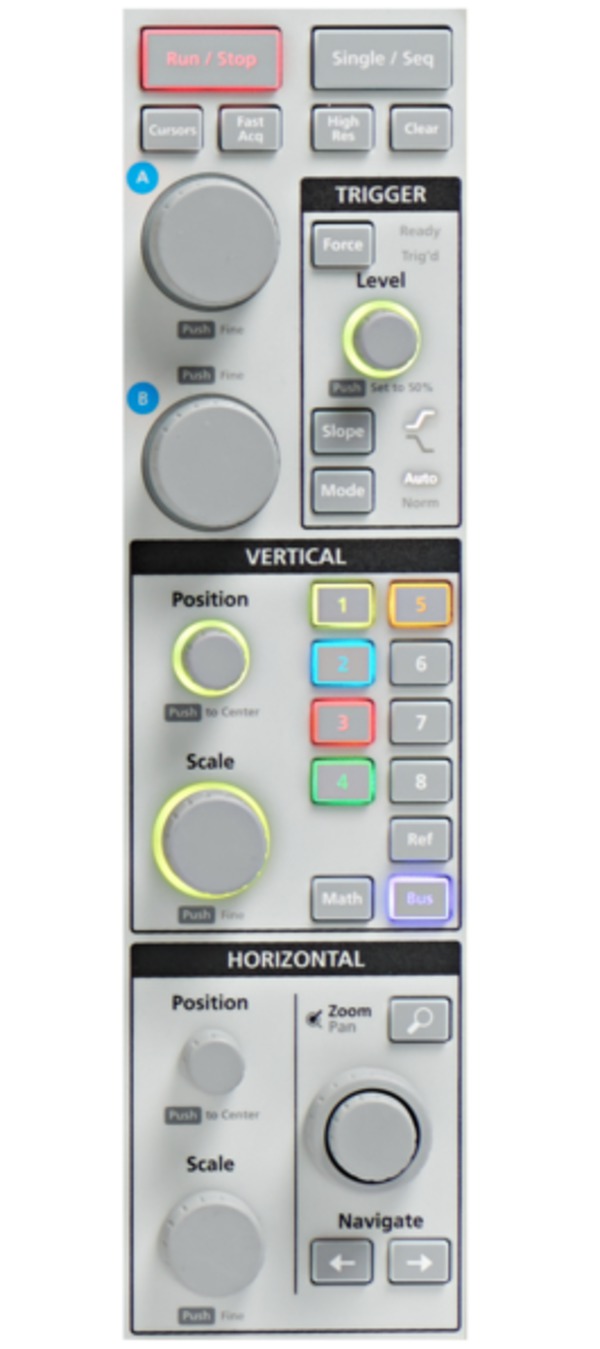
Attention to detail in the front-panel controls
Traditionally, the front face of a scope has been roughly 50% display and 50% controls. The 6 Series MSO display fills about 85% of the face of the instrument. To achieve this, it has a streamlined front panel that retains critical controls for simple intuitive operation, but with a reduced number of menu buttons for functions directly accessed via objects on the display.
Color-coded LED light rings indicate trigger source and vertical scale/position knob assignments. Large, dedicated Run/ Stop and Single Sequence buttons are placed prominently in the upper right, and other functions like Force Trigger, Trigger Slope, Trigger Mode, Default Setup, Auto-set and Quick-save functions are all available using dedicated front panel buttons.
Windows or not – you choose
The 6 Series MSO offers you the choice of whether to include a Microsoft Windows™ operating system.
The 6 Series MSO comes with a standard removable SSD that contains a closed embedded operating system that will boot as a dedicated scope with no ability to run or install other programs. An optional SSD with Windows 10 operating system is available that will boot to an open Windows 10 configuration, so you can minimize the oscilloscope application and access a Windows desktop where you can install and run additional applications on the oscilloscope or you can connect additional monitors and extend your desktop. Simply swap the drives as needed through an access panel on the bottom of the instrument.
Whether you run Windows or not, the oscilloscope operates in exactly the same way with the same look and feel and UI interaction.
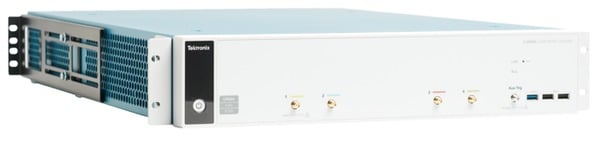
Need higher channel density?
The 6 Series is also available as a low-profile digitizer – the LPD64. With four SMA input channels plus an auxiliary trigger input, in a 2U high package and 12-bit ADC’s, the 6 Series Low Profile Digitizer sets a new standard for performance in applications where extreme channel density is required.
Experience the performance difference
With up to 10 GHz analog bandwidth, 50 GS/s sample rates, standard 62.5 Mpts record length and a 12-bit analog to digital converter (ADC), the 6 Series MSO has the performance you need to capture waveforms with the best possible signal fidelity and resolution for seeing small waveform details.
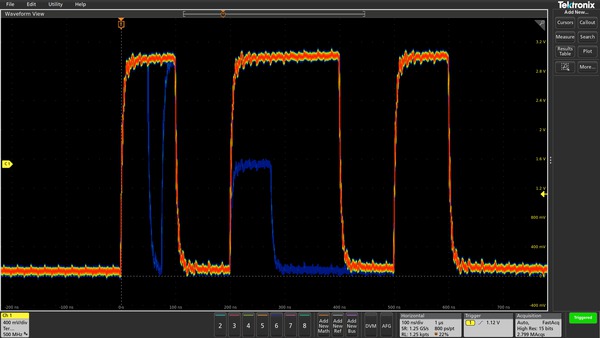
Digital Phosphor technology with FastAcq™ high-speed waveform capture
To debug a design problem, first you must know it exists. Digital phosphor technology with FastAcq provides you with fast insight into the real operation of your device. Its fast waveform capture rate – greater than 500,000 waveforms per second – gives you a high probability of seeing the infrequent problems common in digital systems: runt pulses, glitches, timing issues, and more. To further enhance the visibility of rarely occurring events, intensity grading indicates how often rare transients are occurring relative to normal signal characteristics.
Industry leading vertical resolution
The 6 Series MSO provides the performance to capture the signals of interest while minimizing the effects of unwanted noise when you need to capture high-amplitude signals while seeing smaller signal details. At the heart of the 6 Series MSO are 12-bit analog-to-digital converters (ADCs) that provide 16 times the vertical resolution of traditional 8-bit ADCs.
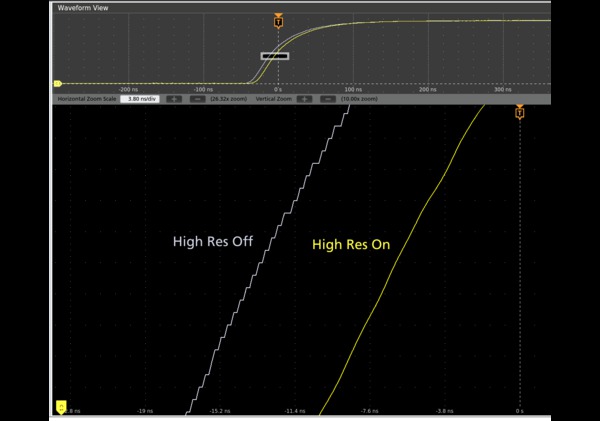
A new High Res mode applies a hardware-based unique Finite Impulse Response (FIR) filter based on the selected sample rate. The FIR filter maintains the maximum bandwidth possible for that sample rate while preventing aliasing and removing noise from the oscilloscope amplifiers and ADC above the usable bandwidth for the selected sample rate.
High Res mode always provides at least 12 bits of vertical resolution and extends all the way to 16 bits of vertical resolution at ≤ 625 MS/s sample rates and 200 MHz of bandwidth. The following table shows the number of bits of vertical resolution for each sample rate setting when in High Res.
| Sample rate | Number of bits of vertical resolution |
|---|---|
| 50 GS/s | 8 |
| 25 GS/s | 8 |
| 12.5 GS/s | 12 |
| 6.25 GS/s | 13 |
| 3.125 GS/s | 14 |
| 1.25 GS/s | 15 |
| ≤625 MS/s | 16 |
New lower-noise front end amplifiers further improve the 6 Series MSO’s ability to resolve fine signal detail.
A new TEK061 front end amplifier sets a new standard for low-noise acquisition providing the best signal fidelity to capture small signals with high resolution.
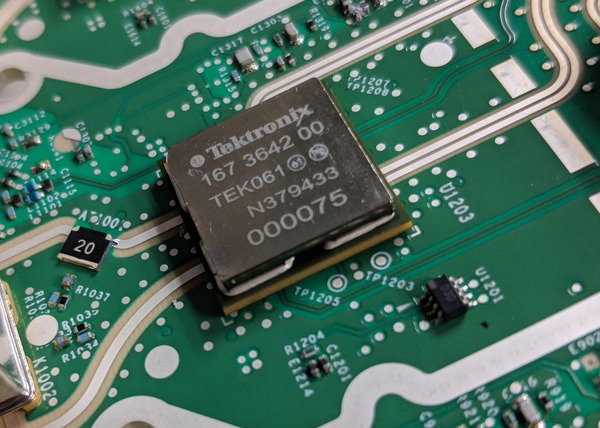
A key attribute to being able to view fine signal details on small, high-speed signals is noise. The higher a measurement systems’ intrinsic noise, the less true signal detail will be visible. This becomes more critical on an oscilloscope when the vertical settings are set to high sensitivity (like ≤ 10mV/div) in order to view small signals that are prevalent in high-speed bus topologies. The 6 Series MSO has a new front-end ASIC, the TEK061, that enables breakthrough noise performance at the highest sensitivity settings. The ‘B’ version of the 6 Series MSO has a new 50 GS/s low noise interleave sample rate on up to two channels that reduces noise by almost 3 dB at higher volts/div settings, furthering the advantage over competitive scopes in low noise performance. The table below shows a comparison of typical noise performance of the 6 Series MSO and prior generations of Tektronix oscilloscopes in this bandwidth range.
| Bandwidth | V/Div | 6 Series B MSO | DPO7000C | MSO/DPO70000C |
|---|---|---|---|---|
| 1 GHz | 1 mV | 51.8 µV | 90 µV 1 | N/A |
| 10 mV | 82.9 µV | 279 µV | N/A | |
| 100 mV | 829 µV | 2.7 mV | N/A | |
| 4 GHz | 1 mV | 97.4 µV | N/A | N/A |
| 10 mV | 171 µV | N/A | 500 µV | |
| 100 mV | 1.73 mV | N/A | 4.3 mV | |
| 8 GHz | 1 mV | 153 µV | N/A | N/A |
| 10 mV | 287 µV | N/A | 580 µV | |
| 100 mV | 2.94 mV | N/A | 4.5 mV |
1Bandwidth limited to 200 MHz.
Triggering
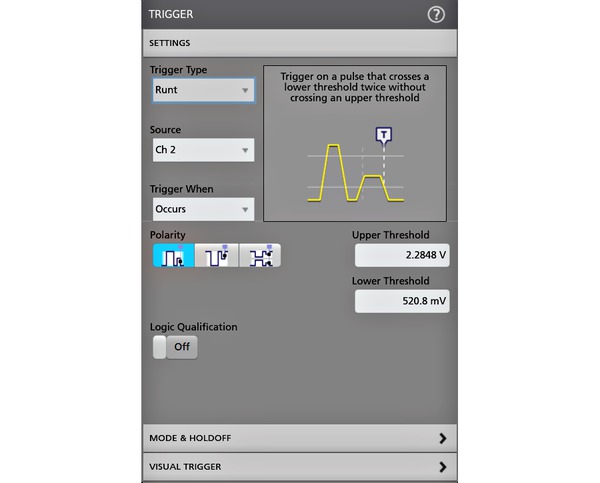
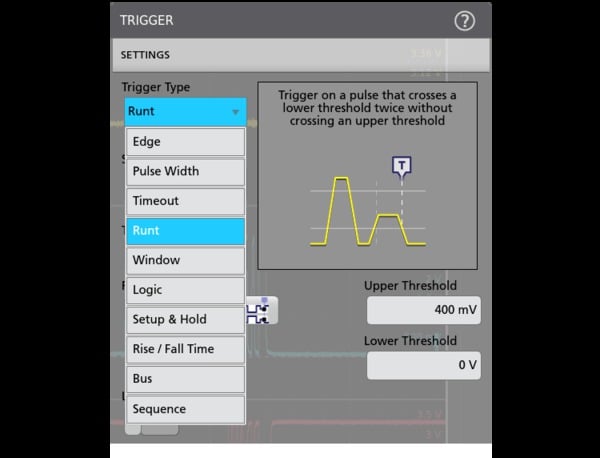
Discovering a device fault is only the first step. Next, you must capture the event of interest to identify root cause. The 6 Series MSO provides a complete set of advanced triggers, including:
- Runt
- Logic
- Pulse width
- Window
- Timeout
- Rise/Fall time
- Setup and Hold violation
- Serial packet
- Parallel data
- Sequence
- Video
- Visual Trigger
- RF Frequency vs. Time
- RF Magnitude vs. Time
With up to a 1 Gpoint record length, you can capture many events of interest, even thousands of serial packets in a single acquisition, providing high-resolution to zoom in on fine signal details and record reliable measurements.
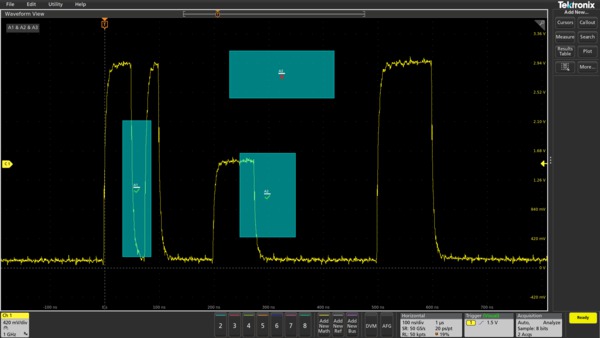
Visual trigger – Finding the signal of interest quickly
Finding the right cycle of a complex bus can require hours of collecting and sorting through thousands of acquisitions for an event of interest. Defining a trigger that isolates the desired event speeds up debug and analysis efforts.
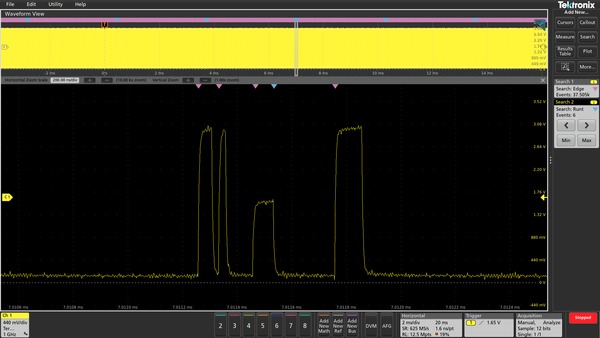
Visual Trigger extends the 6 Series MSO’s triggering capabilities by scanning through all waveform acquisitions and comparing them to on-screen areas (geometric shapes). An unlimited number of areas can be created using a mouse or touchscreen, and a variety of shapes (triangles, rectangles, hexagons, or trapezoids) can be used to specify the desired trigger behavior. Once shapes are created, they can be edited interactively to create custom shapes and ideal trigger conditions.
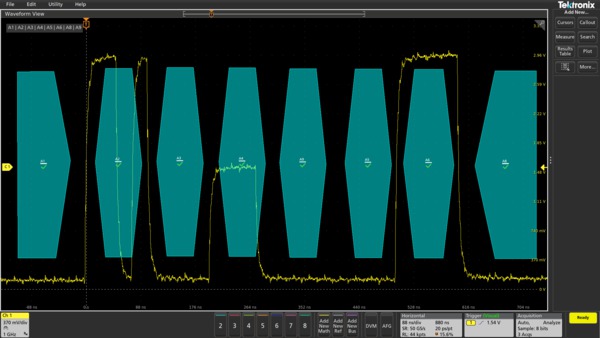
By triggering only on the most important signal events, Visual Trigger can save hours of capturing and manually searching through acquisitions. In seconds or minutes, you can find the critical events and complete your debug and analysis efforts. Visual Trigger even works across multiple channels, extending its usefulness to complex system troubleshooting and debug tasks.
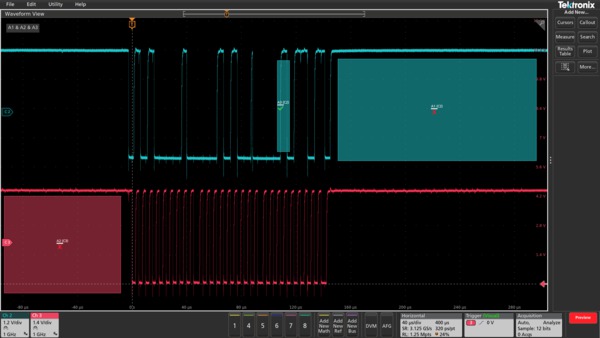
Once multiple areas are defined, a Boolean logic equation can be used to set complex trigger conditions using on-screen editing features.
TekVPI Probe Interface
The TekVPI®probe interface sets the standard for ease of use in probing. In addition to the secure, reliable connection that the interface provides, many TekVPI probes feature status indicators and controls, as well as a probe menu button right on the comp box itself. This button brings up a probe menu on the oscilloscope display with all relevant settings and controls for the probe. The TekVPI interface enables direct attachment of current probes without requiring a separate power supply. TekVPI probes can be controlled remotely through USB or LAN, enabling more versatile solutions in ATE environments. The 6 Series MSO provides up to 80 W of power to the front panel connectors, sufficient to power all connected TekVPI probes without the need for an additional probe power supply.
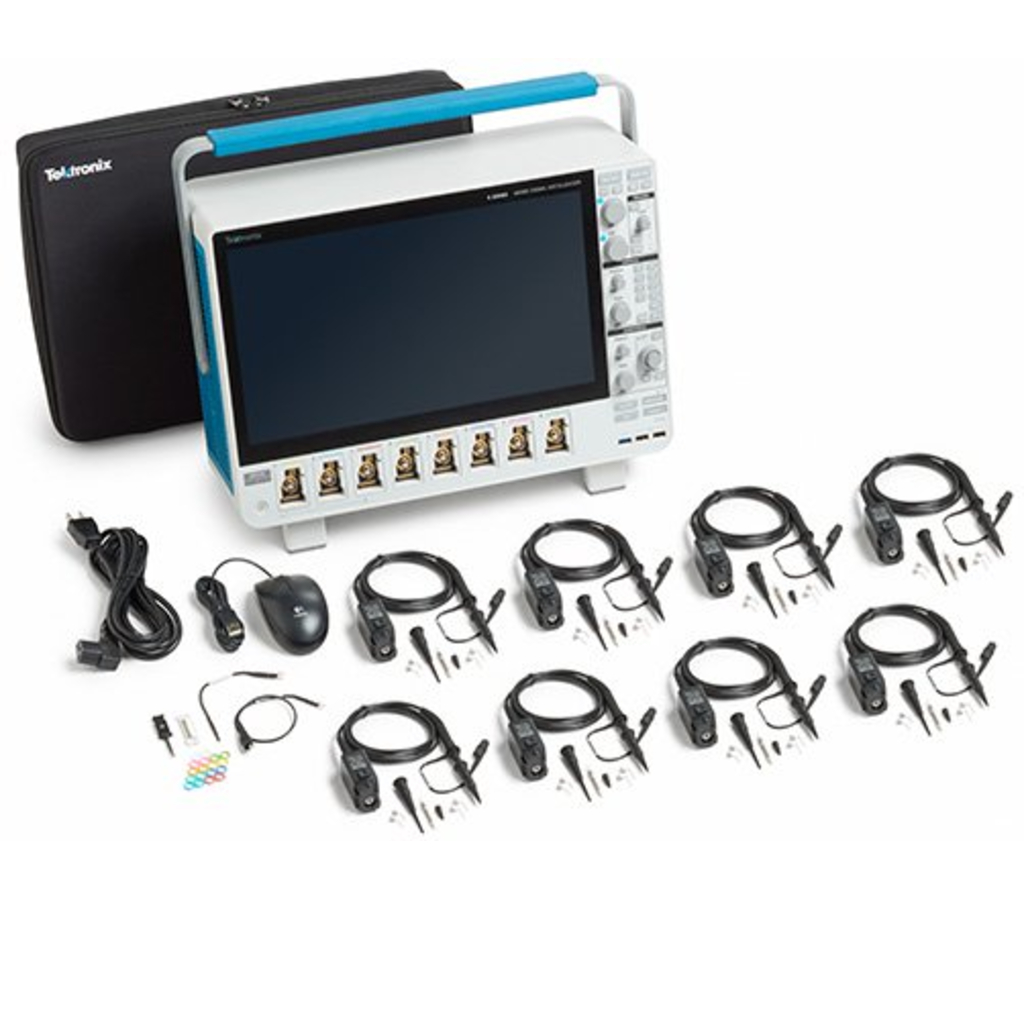
Convenient high speed passive voltage probing
The TPP Series passive voltage probes included with every 6 Series MSO offer all the benefits of general-purpose probes – high dynamic range, flexible connection options, and robust mechanical design – while providing the performance of active probes. Up to 1 GHz analog bandwidth enables you to see high frequency components in your signals, and extremely low 3.9 pF capacitive loading minimizes adverse effects on your circuits and is more forgiving of longer ground leads.
An optional, low-attenuation (2X) version of the TPP probe is available for measuring low voltages. Unlike other low-attenuation passive probes, the TPP0502 has high bandwidth (500 MHz) as well as low capacitive loading (12.7 pF).
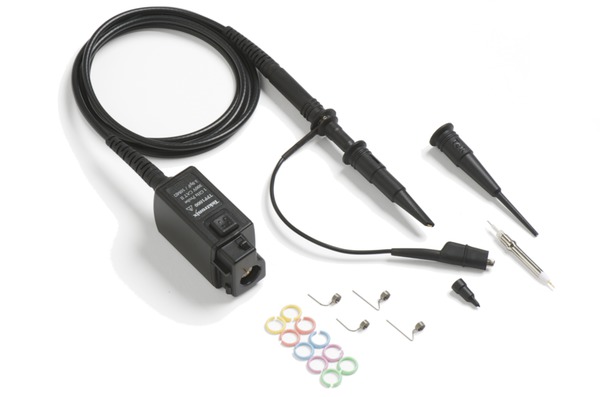
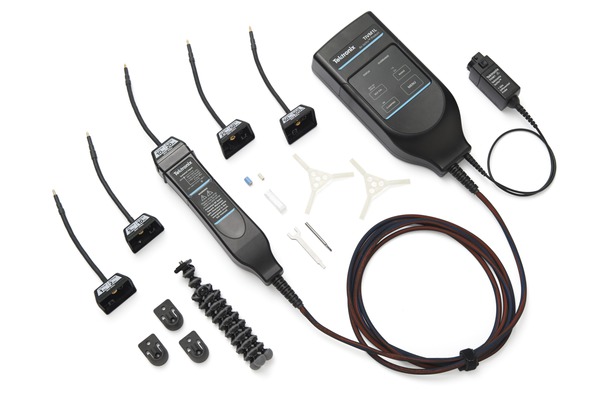
TDP7700 Series TriMode Probes
The TDP7700 Series TriMode probes provide the highest probe fidelity available for real-time oscilloscopes. The TDP7700 is designed for use with the 6 Series MSO, with full AC calibration of the probe and tip’s signal path based on unique S-parameter models. The probe communicates the S-parameters to the scope via the TekVPI probe interface and the 6 Series MSO includes them to achieve the very best signal fidelity possible from probe tip to acquisition memory. Connectivity innovations such as solder-down tips with the probe’s input buffer mounted only a few millimeters from the end of the tip, the TDP7700 Series probes provide unmatched usability for connecting to today’s most challenging electronic designs.
With TriMode probing one probe setup makes differential, single ended, and common mode measurements accurately. This unique capability allows you to work more effectively and efficiently, switching between differential, single ended and common mode measurements without moving the probe’s connection point.
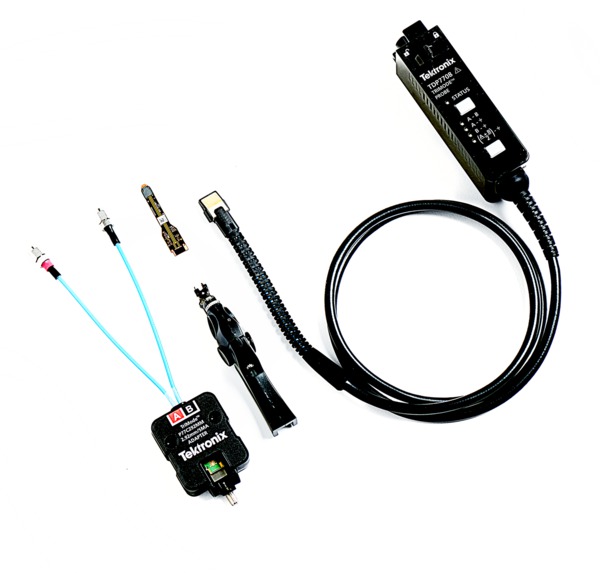
IsoVu™ Isolated Measurement System
Whether designing an inverter, optimizing a power supply, testing communication links, measuring across a current shunt resistor, debugging EMI or ESD issues, or trying to eliminate ground loops in your test setup, common mode interference has caused engineers to design, debug, evaluate, and optimize “blind” until now.
Tektronix’ revolutionary IsoVu technology uses optical communications and power-over-fiber for complete galvanic isolation. When combined with the 6 Series MSO equipped with the TekVPI interface, it is the first, and only, measurement system capable of accurately resolving high bandwidth, differential signals, in the presence of large common mode voltage with:
- Complete galvanic isolation
- Up to 1 GHz bandwidth
- 1 Million to 1 (120 dB) common mode rejection at 100 MHz
- 10,000 to 1 (80 dB) of common mode rejection at full bandwidth
- Up to 2,500 V differential dynamic range
- 60 kV common mode voltage range
Comprehensive analysis for fast insight
Basic waveform analysis
Verifying that your prototype’s performance matches simulations and meets the project’s design goals requires careful analysis, ranging from simple checks of rise times and pulse widths to sophisticated power loss analysis, characterization of system clocks, and investigation of noise sources.
The 6 Series MSO offers a comprehensive set of standard analysis tools including:
- Waveform- and screen-based cursors
- 36 automated measurements. Measurement results include all instances in the record, the ability to navigate from one occurrence to the next, and immediate viewing of the minimum or maximum result found in the record
- Basic waveform math
- Basic FFT analysis
- Advanced waveform math including arbitrary equation editing with filters and variables
- Spectrum view frequency domain analysis with independent controls for time and frequency domains
- FastFrame™ Segmented Memory enables you to make efficient use of the oscilloscope’s acquisition memory by capturing many trigger events in a single record while eliminating the large time gaps between events of interest. View and measure the segments individually or as an overlay.
Measurement results tables provide comprehensive statistical views of measurement results with statistics across both the current acquisition and all acquisitions.
Callouts

Documenting test results and methods is critical when sharing data across a team, recreating a measurement at a later date, or delivering a customer report. With a few taps on the screen, you can create as many custom callouts as needed; enabling you to document the specific details of your test results. With each callout, you can customize the text, location, color, font size, and font.
Navigation and search
Finding your event of interest in a long waveform record can be time consuming without the right search tools. With today’s record lengths of many millions of data points, locating your event can mean scrolling through literally thousands of screens of signal activity.
The 6 Series MSO offers the industry’s most comprehensive search and waveform navigation with its innovative Wave Inspector®controls. These controls speed panning and zooming through your record. With a unique force-feedback system, you can move from one end of your record to the other in just seconds. Or, use intuitive drag and pinch/expand gestures on the display itself to investigate areas of interest in a long record.
The Search feature allows you to automatically search through your long acquisition looking for user-defined events. All occurrences of the event are highlighted with search marks and are easily navigated to, using the Previous ( ← ) and Next ( → ) buttons found on the front panel or on the Search badge on the display. Search types include edge, pulse width, timeout, runt, window, logic, setup and hold, rise/fall time and parallel/serial bus packet content. You can define as many unique searches as you like.
You can also quickly jump to the minimum and maximum value of search results by using the Min and Max buttons on the Search badge.
Mask and limit testing (optional)
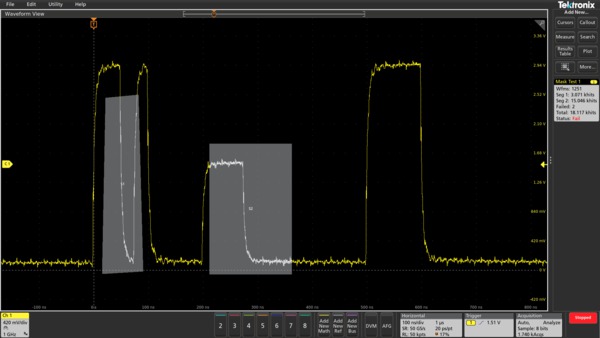
Whether you are focused on signal integrity or setting up pass/fail conditions for production, mask testing is an efficient tool to characterize the behaviour of certain signals in a system. Quickly create custom masks by drawing mask segments on the screen. Tailor a test to your specific requirements and set actions to take when a mask hit is registered, or when a complete test passes or fails.
Limit testing is an insightful way to monitor the long-term behaviour of signals, helping you characterize a new design or confirm hardware performance during production line testing. Limit tests compare your live signal to an ideal, or golden version of the same signal with user-defined vertical and horizontal tolerances.
You can easily tailor a mask or limit test to your specific requirements by:
- Defining test duration in number of waveforms
- Setting a violation threshold that must be met before considering a test a failure
- Counting violations/failures and reporting statistical information
- Setting actions upon violations, test failure, and test complete
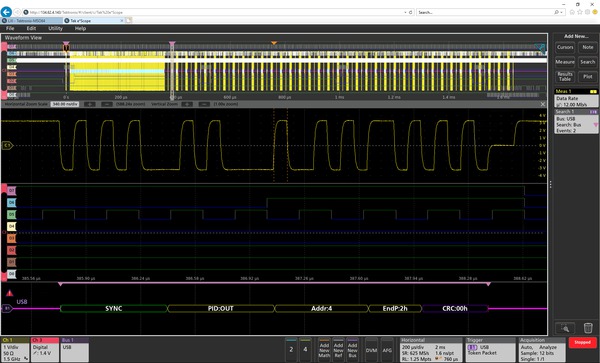
Serial protocol triggering and analysis (optional)
During debugging, it can be invaluable to trace the flow of activity through a system by observing the traffic on one or more serial buses. It could take many minutes to manually decode a single serial packet, much less the thousands of packets that may be present in a long acquisition.
And if you know the event of interest that you are attempting to capture occurs when a particular command is sent across a serial bus, wouldn’t it be nice if you could trigger on that event? Unfortunately, it’s not as easy as simply specifying an edge or a pulse width trigger.
The 6 Series MSO offers a robust set of tools for working with the most common serial buses found in embedded design including I2C, SPI, I3C, RS-232/422/485/UART, SPMI, CAN, CAN FD, LIN, FlexRay, SENT, PSI5, Automotive Ethernet, MIPI D-PHY, USB LS/FS/HS, eUSB 2.0, Ethernet 10/100, Audio (I2S/LJ/RJ/TDM), MIL-STD-1553, ARINC 429, Spacewire, 8B/10B, MDIO, SVID,Manchester, and NRZ.
Serial protocol search enables you to search through a long acquisition of serial packets and find the ones that contain the specific packet content you specify. Each occurrence is highlighted by a search mark. Rapid navigation between marks is as simple as pressing the Previous ( ← ) and Next ( → ) buttons on the front panel or in the Search badge that appears in the Results Bar.
The tools described for serial buses also work on parallel buses. Support for parallel buses is standard in the 6 Series MSO. Parallel buses can be up to 64 bits wide and can include a combination of analog and digital channels.
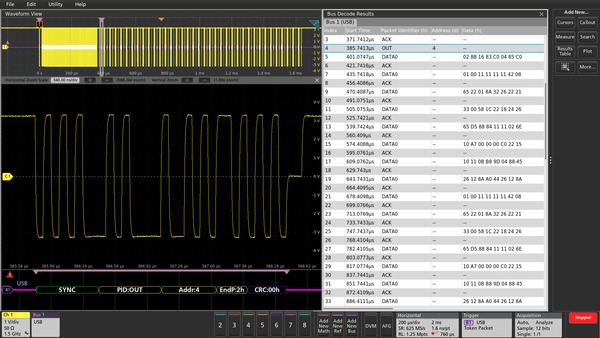
- Serial protocol triggering lets you trigger on specific packet content including start of packet, specific addresses, specific data content, unique identifiers, and errors.
- Bus waveforms provide a higher-level, combined view of the individual signals (clock, data, chip enable, and so on) that make up your bus, making it easy to identify where packets begin and end, and identifying sub-packet components such as address, data, identifier, CRC, and so on.
- The bus waveform is time aligned with all other displayed signals, making it easy to measure timing relationships across various parts of the system under test.
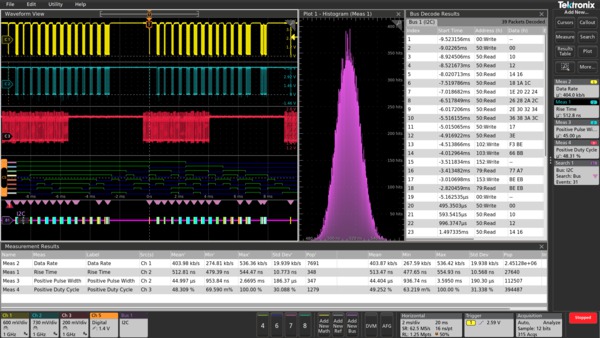
- Bus decode tables provide a tabular view of all decoded packets in an acquisition much like you would see in a software listing. Packets are time stamped and listed consecutively with columns for each component (Address, Data, and so on).
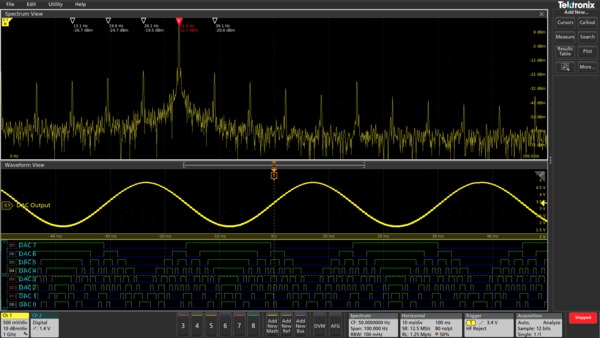
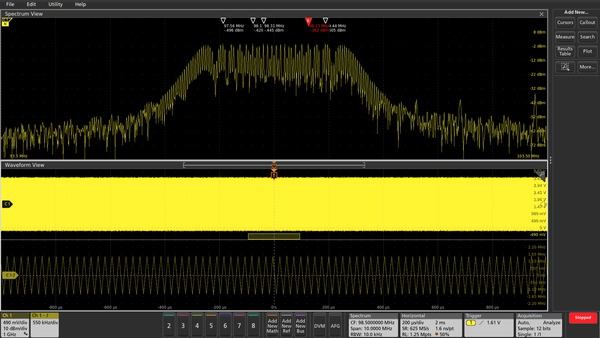
Spectrum View
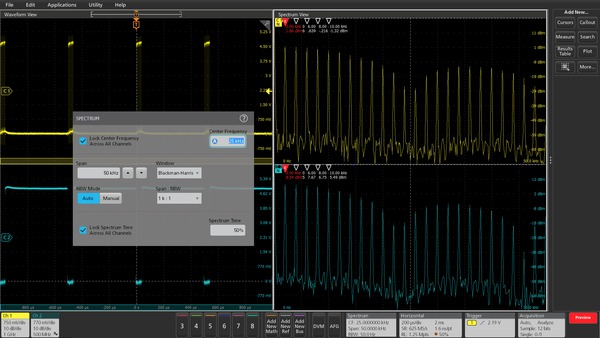
Intuitive spectrum analyzer controls like center frequency, span and resolution bandwidth (RBW), independent from time domain controls, provide easy setup for frequency domain analysis. A spectrum view is available for each FlexChannel analog input, enabling multi-channel mixed domain analysis.
It is often easier to debug an issue by viewing one or more signals in the frequency domain. Oscilloscopes have included math-based FFTs for decades in an attempt to address this need. However, FFTs are notoriously difficult to use for two primary reasons.
First, when performing frequency-domain analysis, you think about controls like Center Frequency, Span, and Resolution Bandwidth (RBW), as you would typically find on a spectrum analyzer. But then you use an FFT, where you are stuck with traditional scope controls like sample rate, record length and time/div and have to perform all the mental translations to try to get the view you’re looking for in the frequency-domain.
Second, FFTs are driven by the same acquisition system that’s delivering the analog time-domain view. When you optimize acquisition settings for the analog view, your frequency-domain view isn’t what you want. When you get the frequency-domain view you want, your analog view is not what you want. With math-based FFTs, it is virtually impossible to get optimized views in both domains.
Spectrum View changes all of this. Tektronix’ patented technology provides both a decimator for the time-domain and a digital downconverter for the frequency-domain behind each FlexChannel. The two different acquisition paths let you simultaneously observe both time- and frequency-domain views of the input signal with independent acquisition settings for each domain. Other manufacturers offer various ‘spectral analysis’ packages that claim ease-of-use, but they all exhibit the limitations described above. Only Spectrum View provides both exceptional ease-of-use and the ability to achieve optimal views in both domains simultaneously.
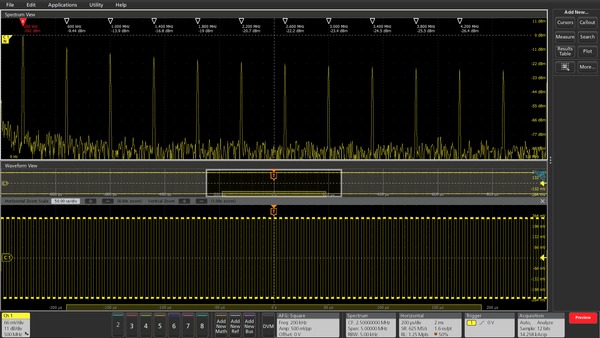
Visualizing changes in the RF signal (optional)
RF time domain traces make it easy to understand what’s happening with a time-varying RF signal. There are three RF time domain traces that are derived from the underlying I and Q data of Spectrum View:
- Magnitude – The instantaneous amplitude of the spectrum vs. time.
- Frequency – The instantaneous frequency of the spectrum relative to the center frequency vs. time.
- Phase – The instantaneous phase of the spectrum relative to the center frequency vs. time.
Each of these traces can be turned on and off independently, and all three can be displayed simultaneously.
Triggering on changes in the RF signal (optional)
Whether you need to find the source of electromagnetic interference or understand the behavior of a VCO, hardware triggers for RF versus time make it easy to isolate, capture, and understand the RF signal behavior. Trigger on edges, pulse widths, and timeout behavior of RF magnitude vs. time and RF frequency vs. time.
Comprehensive vector signal analysis with SignalVu-PC (optional)
Enter a short description of your concept here (optional).
When analysis needs go beyond the basic spectrum, amplitude, frequency, and phase vs. time you can employ the SignalVu-PC vector signal analysis application. This enables in-depth transient RF signal analysis, detailed RF pulse characterization, and comprehensive analog and digital RF modulation analysis.
Three options are required to enable SignalVu-PC running on your 6 Series Oscilloscope. First, unless you plan to run the application from a separate Windows PC, the Windows SSD (6-WIN) needs to be installed in the scope. Second, the Spectrum View RF versus time traces option (6-SV-RFVT) needs to be installed in the scope to enable I/Q data to be transferred. Third, the Connect (CONxx-SVPC) license needs to be installed in SignalVu-PC to enable base features of SignalVu-PC, which includes 16+ RF measurements and displays.
The RF digital down-converters and integrated measurement engines behind each channel have your complex mixed-signal and mixed-domain analysis needs covered in one instrument.
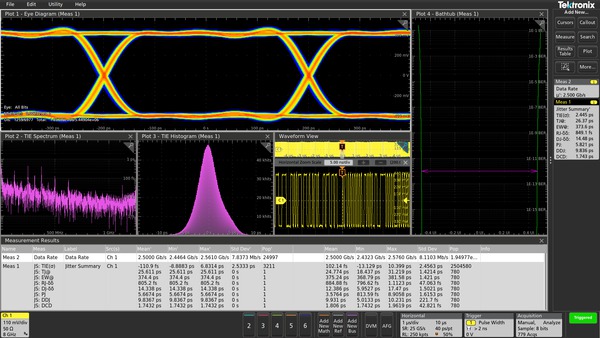
Jitter analysis
The 6 Series MSO has seamlessly integrated the DPOJET Essentials jitter and eye pattern analysis software package, extending the oscilloscope’s capabilities to take measurements over contiguous clock and data cycles in a single-shot real-time acquisition. This enables measurement of key jitter and timing analysis parameters such as Time Interval Error and Phase Noise to help characterize possible system timing issues.
Analysis tools, such as plots for time trends and histograms, quickly show how timing parameters change over time, and spectrum analysis quickly shows the precise frequency and amplitude of jitter and modulation sources.
Option 6-DJA adds additional jitter analysis capability to better characterize your device’s performance. The 31 additional measurements provide comprehensive jitter and eye-diagram analysis and jitter decomposition algorithms, enabling the discovery of signal integrity issues and their related sources in today’s high-speed serial, digital, and communication system designs. Option 6-DJA also provides eye diagram mask testing for automated pass/fail testing.
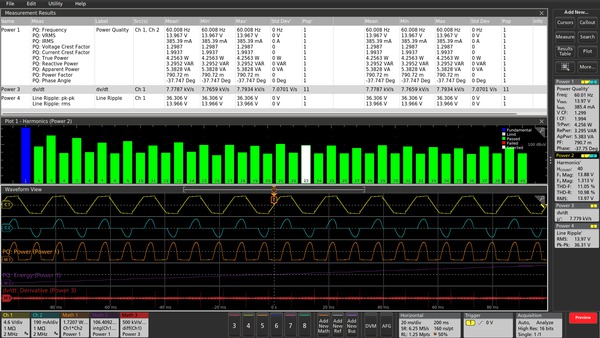
Power analysis (optional)
The 6 Series MSO has also integrated the optional 6-PWR power analysis package into the oscilloscope’s automatic measurement system to enable quick and repeatable analysis of power quality, input capacitance, in-rush current, harmonics, switching loss, safe operating area (SOA), modulation, ripple, magnetics measurements, efficiency, amplitude and timing measurements, slew rate (dv/dt and di/dt), Control Loop Response (Bode Plot), and Power Supply Rejection Ratio (PSRR).
Measurement automation optimizes the measurement quality and repeatability at the touch of a button, without the need for an external PC or complex software setup.
Inverter Motor Drive Analysis (IMDA)(optional)
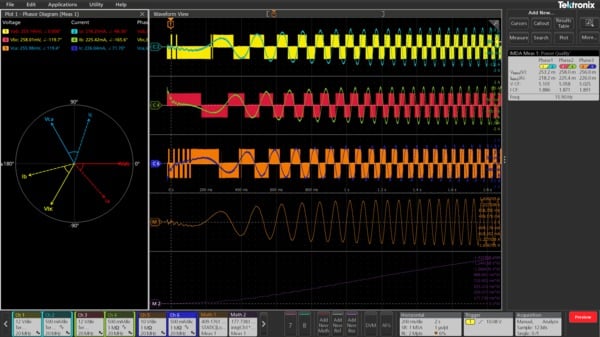
During the design and validation of systems that utilize 3-Phase power, it can be difficult to correlate control systems and power electronics with the performance of the overall system.
This will give you deeper insights enabling you to debug the design, efficiency and reliability of:
- 3-Phase power inverters, converters, power supplies, and automotive 3-Phase designs for DC-AC topology
- Motors (brushless AC, brushless DC, induction, permanent magnet, universal, stepper, rotor)
- Drives (AC, DC, variable frequency, servo)
The automated measurements that are included with 6-IMDA are:
- Input analysis
- Power quality with phasor diagram
- Harmonics
- Input voltage
- Input current
- Input power
- Ripple analysis
- Line Ripple
- Switching Ripple
- Output analysis
- Phasor diagram
- Efficiency
- Wiring configurations
- 1 Volt/1 Current – 1P2W
- 2 Volt/2 Current – 1P3W
- 2 Volt/2 Current – 3P3W
- 3 Volt/3 Current – 3P3W
- 3 Volt/3 Current – 3P4W
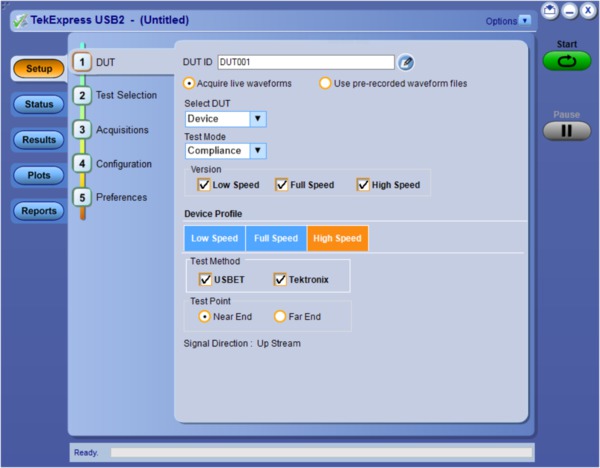
Compliance test
A key focus area for embedded designers is testing various embedded and interface technologies for compliance. This ensures the device passes the logo certification at plugfests and achieves successful interoperability when working with other compliant devices.
The compliance test specifications for high speed serial standards like USB, Ethernet, Memory, Display and MIPI are developed by the respective consortiums, or governing bodies. Working closely with these consortiums, Tektronix has developed oscilloscope-based compliance applications that not only focus on providing pass/fail results but also provide deeper insight into any failures by providing relevant measurement tools such as jitter and timing analysis to debug failing designs.
These automated compliance applications are built on a framework that provides:
- Complete test coverage per the specification.
- Fast test times with optimized acquisitions and test sequencing based on customized settings.
- Analysis based on previously-acquired signals, allowing the device under test (DUT) to be disconnected from the setup once all acquisitions are completed. This also allows analysis of waveforms acquired on a different oscilloscope or captured at a remote lab, facilitating a very collaborative test environment.
- Signal validation during acquisition to ensure the right signals are being captured.
- Additional parametric measurements for design debug.
- Custom eye diagram mask testing for insight into design margin.
- Detailed reports in multiple formats with setup information, results, margins, waveform screenshots and plot images.
Designed with your needs in mind
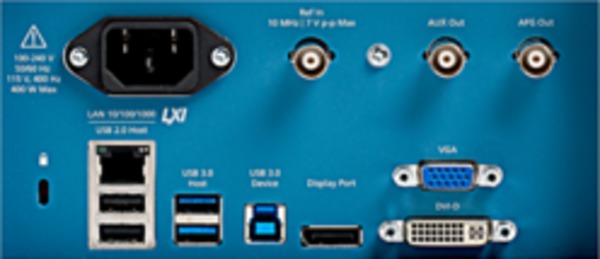
Connectivity
The 6 Series MSO contains a number of ports which you can use to connect the instrument to a network, directly to a PC, or to other test equipment.
- Two USB 2.0 and one USB 3.0 host ports on the front and four more USB host ports (two 2.0, two 3.0) on the rear panel enable easy transfer of screen shots, instrument settings, and waveform data to a USB mass storage device. A USB mouse and keyboard can also be attached to USB host ports for instrument control and data entry.
- The rear panel USB Device port is useful for controlling the oscilloscope remotely from a PC.
- The standard 10/100/1000BASE-T Ethernet port on the rear of the instrument enables easy connection to networks and provides LXI Core 2011 compatibility.
- DVI-D, Display Port and VGA ports on the rear of the instrument lets you duplicate the instrument display on an external monitor or projector.
Remote operation to improve collaboration
Want to collaborate with a design team on the other side of the world?
The embedded e*Scope®capability enables fast control of the oscilloscope over a network connection through a standard web browser. Simply enter the IP address or network name of the oscilloscope and a web page will be served to the browser. Control the oscilloscope remotely in the exact same way that you do in-person. Alternatively, you can use Microsoft Windows Remote Desktop™ capability to connect directly to your oscilloscope and control it remotely.
The industry-standard TekVISA™ protocol interface is included for using and enhancing Windows applications for data analysis and documentation. IVI-COM instrument drivers are included to enable easy communication with the oscilloscope using LAN or USBTMC connections from an external PC.
e*Scope provides simple remote viewing and control using common web browsers.
PC-based analysis and remote connection to your scope
Get the analysis capability of an award-winning oscilloscope on your PC. Analyze waveforms anywhere, anytime. The basic package is free and lets you scale and measure waveforms. Purchased options add advanced capabilities such as multi-scope analysis, bus decoding, power analysis and jitter analysis.
Key features of the TekScope PC analysis software include:
- Recall Tektronix oscilloscope sessions and waveform files from equipment made by Tektronix and other vendors. Waveform file formats supported include .wfm, .isf, .csv, .h5, .tr0, .trc, and .bin
- Remotely connect to Tektronix 4/5/6 Series MSOs to acquire data in real time
- Share data remotely with your colleagues so that they can perform analysis and make measurements as if they were sitting in front of the oscilloscope
- Synchronize waveforms from multiple oscilloscopes in real time
- Perform advanced analysis even if your oscilloscope isn’t equipped with it
Arbitrary/Function Generator (AFG)
The instrument contains an optional integrated arbitrary/function generator, perfect for simulating sensor signals within a design or adding noise to signals to perform margin testing. The integrated function generator provides output of predefined waveforms up to 50 MHz for sine, square, pulse, ramp/triangle, DC, noise, sin(x)/x (Sinc), Gaussian, Lorentz, exponential rise/fall, Haversine and cardiac. The AFG can load waveform records up to 128 k points in size from an internal file location or a USB mass storage device.
The AFG feature is compatible with Tektronix’ ArbExpress PC-based waveform creation and editing software, making creation of complex waveforms fast and easy.
Digital Voltmeter (DVM) and Trigger Frequency Counter
The instrument contains an integrated 4-digit digital voltmeter (DVM) and 8-digit trigger frequency counter. Any of the analog inputs can be a source for the voltmeter, using the same probes that are already attached for general oscilloscope usage. The trigger frequency counter provides a very precise readout of the frequency of the trigger event on which you’re triggering.
Both the DVM and trigger frequency counter are available for free and are activated when you register your product.
Enhanced security option
The optional 6-SEC enhanced security option enables password-protected enabling/disabling of all instrument I/O ports and firmware upgrades. In addition, a password protected BIOS is installed enabling protection to changes in the compute platform. Option 6-SEC is developed in compliance with National Industrial Security Program Operating Manual (NISPOM) DoD 5220.22-M, Chapter 8 requirements and Defense Security Service Manual for the Certification and Accreditation of Classified Systems under the NISPOM. This ensures that you can confidently move the instrument out of a secure area.
Sanitization of the instrument is easy, simply remove the SSD from the instrument and remove power. You can then remove the instrument from a secure environment for calibration or movement to a new location.
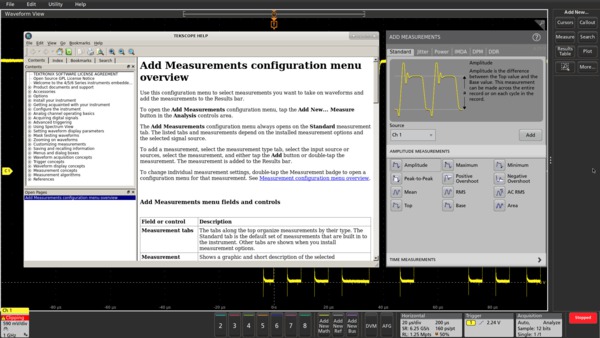
Help when you need it
The 6 Series MSO includes several helpful resources so you can get your questions answered rapidly without having to find a manual or go to a website:
- Graphical images and explanatory text are used in numerous menus to provide quick feature overviews.
- All menus include a question mark icon in the upper right that takes you directly to the portion of the integrated help system that applies to that menu.
- A short user interface tutorial is included in the Help menu for new users to come up to speed on the instrument in a matter of a few minutes.