Description
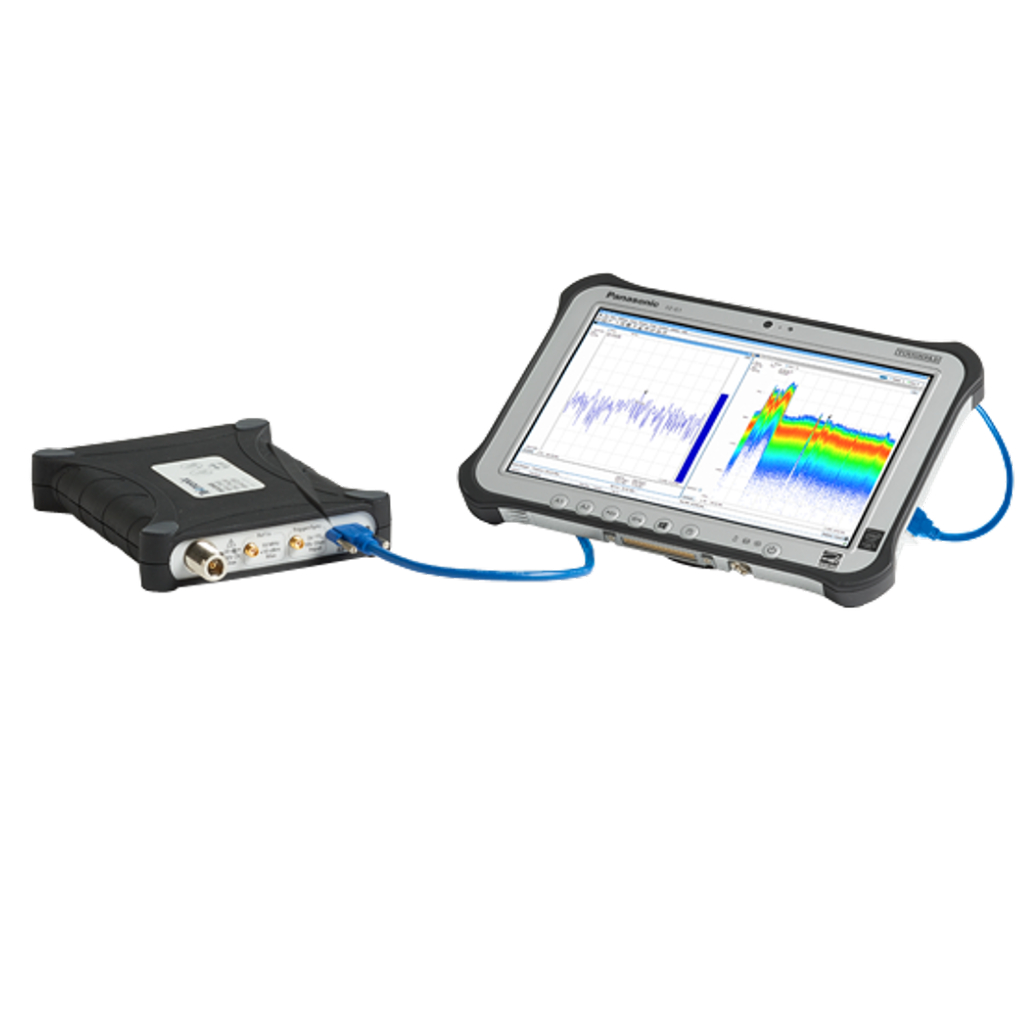
The RSA306B uses your PC and Tektronix SignalVu-PC™ RF Signal Analysis Software to provide real time spectrum analysis, streaming capture and deep signal analysis capabilities for signals from 9 kHz to 6.2 GHz, all in a low-cost, highly portable package that is ideal for field, factory, or academic use.
Key performance specifications
- 9 kHz to 6.2 GHz frequency range covers a broad range of analysis needs
- +20 dBm to -160 dBm measurement range
- Mil-Std 28800 Class 2 environmental, shock and vibration specifications for use in harsh conditions
- Fast sweeps (2 per second) over entire 6.2 GHz span for quick detection of unknown signals
- Acquisition bandwidth of 40 MHz enables wideband vector analysis of modern standards
- Minimum signal duration as short as 15 μsec captured with 100% probability of intercept
Key features
- Full-featured spectrum analysis capability with included Tektronix SignalVu-PC™ software
- 17 spectrum and signal analysis measurement displays enable dozens of measurement types
- Options for mapping, modulation analysis, WLAN, LTE, and Bluetooth standards support, pulse measurements, playback of recorded files, signal survey, and frequency/phase settling
- EMC/EMI pre-compliance and troubleshooting – CISPR detectors, predefined standards, limit lines, easy accessory setup, ambient capture, failure analysis, and report generation
- DataVu-PC software enables multi-unit recording in variable bandwidths
- Real time Spectrum/Spectrogram display to minimize time spent on transient and interference hunting
- Application programming interface (API) included for Microsoft Windows and Linux environments
- MATLAB instrument driver for use with Instrument Control Toolbox
- Streaming capture records long-term events
- Three year warranty
Applications
- Academics/education
- Maintenance, installation and repair in the factory or field
- Value-conscious design and manufacturing
- Interference hunting
The RSA306B: a new class of instrument
The RSA306B offers full-featured spectrum analysis and deep signal analysis at a price unmatched by any previous offering. Using the latest in commercial interfaces and available computing power, the RSA306B separates signal acquisition from measurement, dramatically lowering the cost of instrument hardware. Data analysis, storage and replay is performed on your personal computer, tablet or laptop. Managing the PC separately from the acquisition hardware makes computer upgrades easy, and minimizes IT management issues.
The RSA306B-SMA: for RF Sensor applications
The RSA306B-SMA is a derivative of the RSA306B USB Spectrum Analyzer with the following customer-driven enhancements, enabling convenient integration within custom systems and enclosures:
- Type-SMA RF input connector replacing the Type-N connector
- Optionally available without the protective case (NO SHELL)
- Optionally available with custom mounting hardware (MKIT) available for mounting the no-case chassis in custom enclosures.
SignalVu-PC™ software and an API for deep analysis and fast programmatic interaction
The RSA306B operates with SignalVu-PC, a powerful program that is the basis of Tektronix performance signal analyzers. SignalVu-PC offers a deep analysis capability previously unavailable in value-priced solutions. Real-time processing of the DPX spectrum/spectrogram is enabled in your PC, further reducing the cost of hardware. Customers who need programmatic access to the instrument can choose either the SignalVu-PC programmatic interface or use the included application programming interface (API) that provides a rich set of commands and measurements for Windows and Linux. A MATLAB driver for the API is available, enabling operation with MATLAB and the Instrument Control Toolbox.
DataVu-PC for multi-instrument recording and analysis of large recordings
DataVu-PC software can control two spectrum analyzers simultaneously with independent settings. This allows you to monitor a wide span, while recording at up to 40 MHz bandwidth at any frequency in the range of the instrument. Once recorded, DataVu-PC can find and mark signals of interest based on amplitude and frequency-mask characteristics, eliminating the need for manual inspection of long recordings. Pulse measurements are available on up to 2,000,000 pulses.
Measurements included in SignalVu-PC base version
Basic functionality of the free SignalVu-PC program is far from basic. The table below summarizes the measurements included in the free SignalVu-PC software.
| General signal analysis | |
| Spectrum analyzer | Spans from 1 kHz to 6.2 GHz
Three traces plus math and spectrogram trace Five markers with power, relative power, integrated power, power density and dBc/Hz functions |
| DPX Spectrum/Spectrogram | Real time display of spectrum with 100% probability of intercept of 15 μsec signals in up to 40 MHz span |
| Amplitude, frequency, phase vs. time, RF I and Q vs. time | Basic vector analysis functions |
| Time Overview/Navigator | Enables easy setting of acquisition and analysis times for deep analysis in multiple domains |
| Spectrogram | Analyze and re-analyze your signal with a 2-D or 3-D waterfall display |
| AM/FM listening | Hear, and record to file, FM and AM signals |
| Analog modulation analysis | |
| AM, FM, PM analysis | Measures key AM, FM, PM parameters |
| RF measurements | |
| Spurious measurement | User-defined limit lines and regions provide automatic spectrum violation testing across the entire range of the instrument; Four traces can be saved and recalled; CISPR Quasi-Peak and Average detectors available with option SVQP |
| Spectrum emission mask | User-defined or standards-specific masks |
| Occupied Bandwidth | Measures 99% power, -xdB down points |
| Channel Power and ACLR | Variable channel and adjacent/alternate channel parameters |
| MCPR | Sophisticated, flexible multi-channel power measurements |
| CCDF | Complementary Cumulative Distribution Function plots the statistical variations in signal level |
The RSA306B with SignalVu-PC offers basic and advanced measurements for field and lab
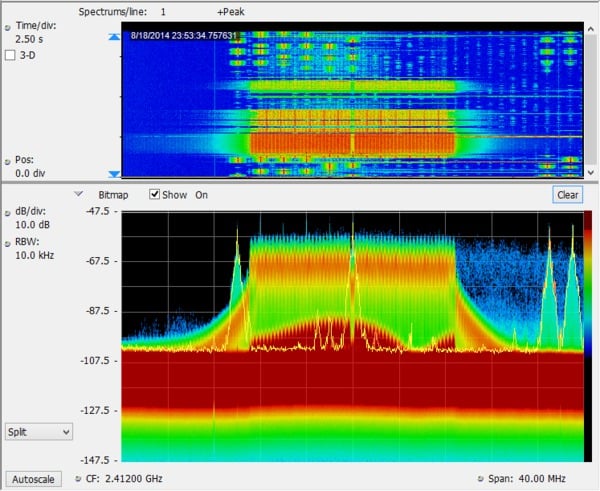
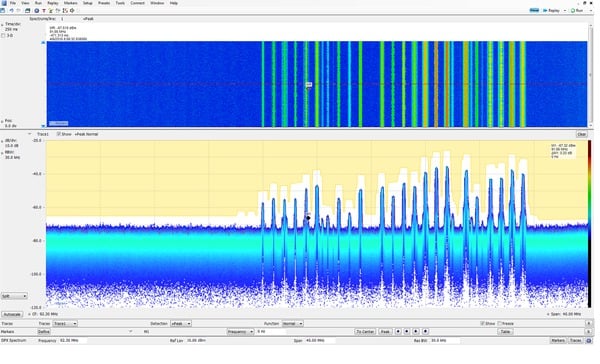
See what you’ve never seen before: The 40 MHz real time bandwidth of the RSA306B combined with the processing power of SignalVu-PC shows you every signal, even down to 15 μs in duration when a high performance PC is used. The following image shows a WLAN transmission (green and orange), and the narrow signals that repeat across the screen are a Bluetooth access probe. The spectrogram (upper part of the screen) clearly separates these signals in time to show any signal collisions.
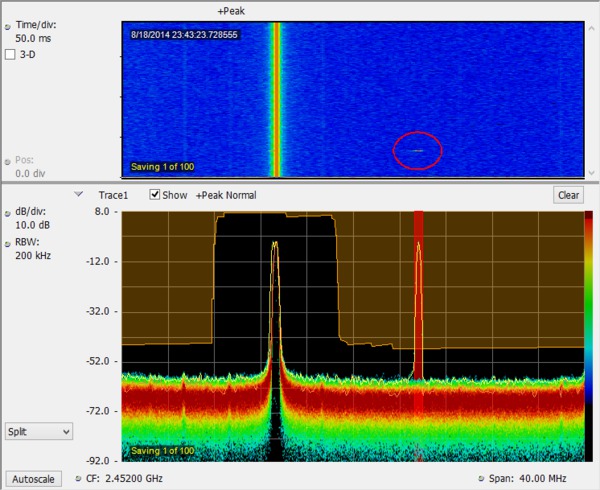
Monitoring has never been easier. Spectrum mask testing captures detail of transients found in the frequency domain, such as intermittent interference. Mask testing can be set to stop acquisition, save acquisition, save a picture, and send an audible alert. The following image shows a spectrum mask (in orange on the spectrum display) created to monitor a band of frequencies for violations. A single transient of 125 μs duration has occurred that violated the mask, with the violation shown in red. The transient is clearly seen on the spectrogram above the red violation area (circled).
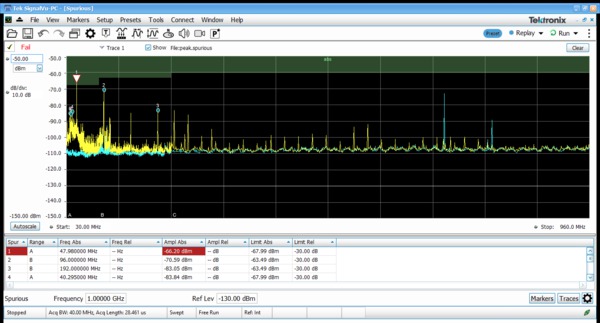
EMI pre-compliance and diagnostic measurements are easy with the RSA306B and SignalVu-PC. Transducer, antenna, preamplifier, and cable gain/loss can be entered and stored in correction files, and the standard spurious measurement feature of SignalVu-PC can be used to establish limit lines for your test. The following illustration shows a test from 30MHz to 960 MHz against the FCC Part 15 Class A limit shown shaded. The blue trace is the capture of Ambient. Violations are recorded in the results table below the graph. CISPR quasi peak and average detectors can be added with option SVQP.
The EMC pre-compliance solution can be added with option EMCVU. It supports many predefined limit lines. It also adds a wizard for easy setup of recommended antennas, LISN, and other EMC accessories with a one-button push. When using the new EMC-EMI display, you can accelerate the test by applying the time consuming quasi peak only on failures. This display also provides a push-button ambient measurement. The Inspect tool lets you measure frequencies of interest locally, removing the need for scanning.
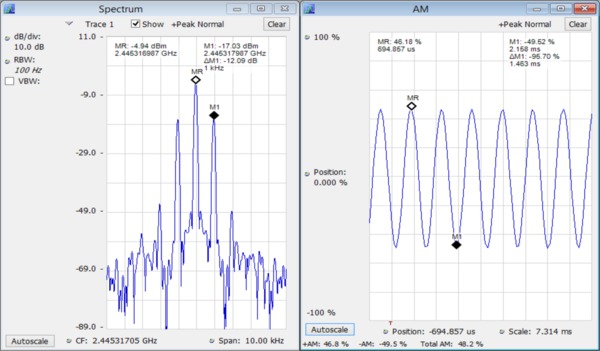
Analysis of AM and FM signals is standard in SignalVu-PC. The following screen shot shows a 1 kHz tone amplitude modulating a carrier to 48.9% total AM. Markers are used on the spectrum display to measure the modulation sideband at 1 kHz offset, 12.28 dB down from the carrier. The same signal is simultaneously viewed in the modulation display, showing AM versus time, with +Peak, -Peak and Total AM measurements. Advanced measurements for analog audio modulation including SINAD, THD and modulation rate are available in Option SVA.
SignalVu-PC application-specific licenses
SignalVu-PC offers a wealth of application-oriented measurement and analysis licenses including:
- General-purpose modulation analysis (27 modulation types including 16/32/64/256 QAM, QPSK, O-QPSK, GMSK, FSK, APSK)
- EMC/EMI analysis with CISPR peak, quasi-peak, and average detectors
- P25 analysis of phase I and phase 2 signals
- WLAN analysis of 802.11a/b/g/j/p, 802.11n, 802.11ac
- LTE™ FDD and TDD Base Station (eNB) Cell ID & RF measurements
- Bluetooth® analysis of Basic Rate, Low Energy, and Bluetooth 5. Some support of Enhanced Data Rate
- Mapping and signal strength
- Pulse analysis
- AM/FM/PM/Direct Audio Measurement including SINAD, THD
- Playback of recorded files, including complete analysis in all domains
- Signal Classification and Survey
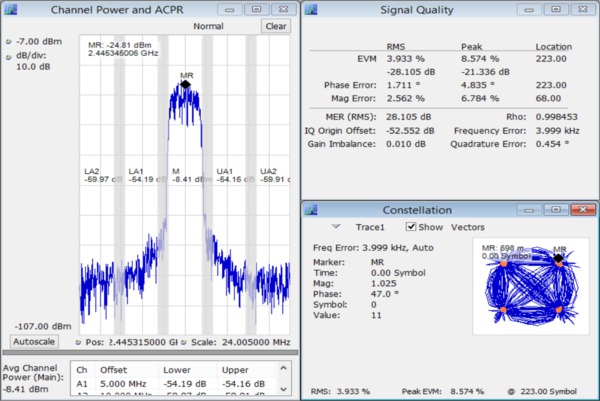
Modulation analysis application SVM enables multiple displays of modulation quality. The following screen shot shows the standard Channel Power/ACLR measurement combined with a constellation display and vector signal quality measurements on a QPSK signal.
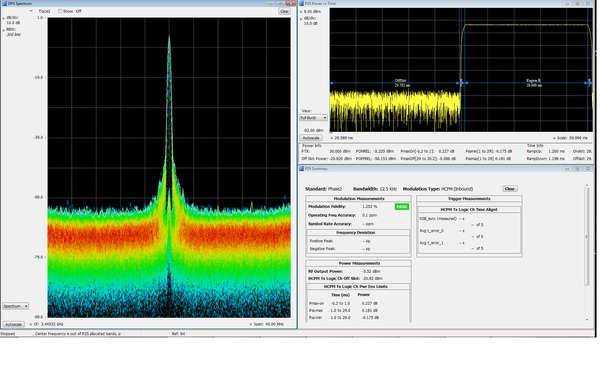
SignalVu-PC application SV26 enables quick, standards-based transmitter health checks on APCO P25 signals. The following image shows a Phase II signal being monitored for anomalies with the spectrum analyzer while performing transmitter power, modulation and frequency measurements.
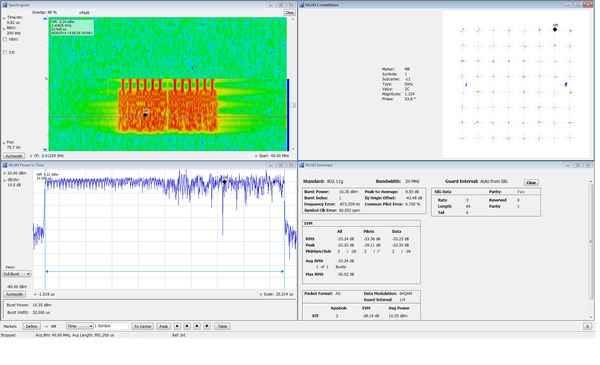
Sophisticated WLAN measurements are easy. On the 802.11g signal shown below, the spectrogram shows the initial pilot sequence followed by the main signal burst. The modulation is automatically detected as 64 QAM for the packet and displayed as a constellation. The data summary indicates an EVM of -33.24 dB RMS, and burst power is measured at 10.35 dBm. SignalVu-PC applications are available for 802.11a/b/j/g/p, 802.11n and 802.11ac to 40 MHz bandwidth.
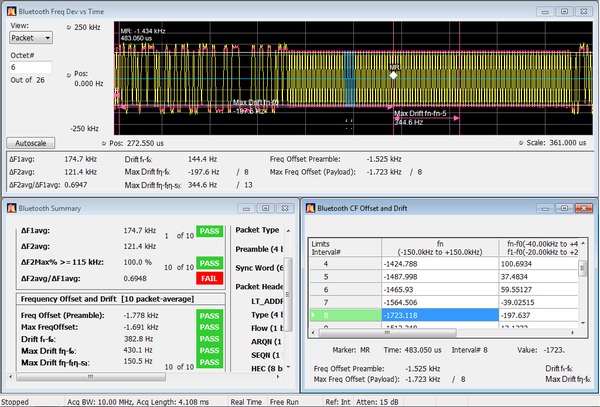
Two new options have been added to help with Bluetooth SIG standard-base transmitter RF measurements in the time, frequency and modulation domains. Option SV27 supports Basic Rate and Low Energy Transmitter measurements defined by RF.TS.4.2.0 and RF-PHY.TS.4.2.0 Test Specification. It also demodulates and provides symbol information for Enhanced Data Rate packets. Option SV31 supports Bluetooth 5 standards (LE 1M, LE 2M, LE Coded) and measurements defined in the Core Specification. Both options also decode the physical layer data that is transmitted and color-encode the fields of packet in the Symbol Table for clear identification.
Pass/Fail results are provided with customizable limits. Measurement below shows deviation vs. time, frequency offset and drift and a measurement summary with Pass/Fail results.
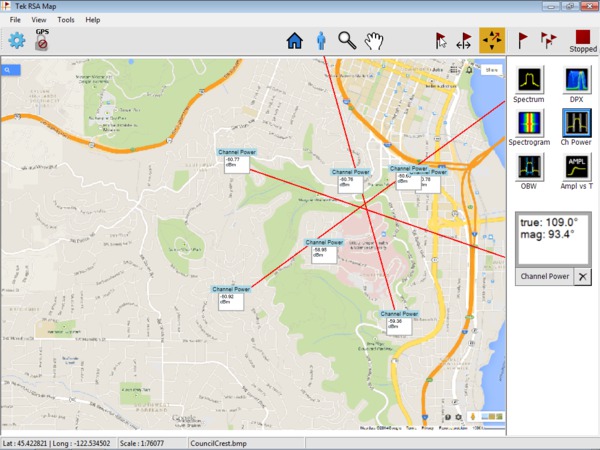
The SignalVu-PC MAP application enables interference hunting and location analysis. Locate interference with an azimuth function that lets you draw a line or an arrow on a mapped measurement to indicate the direction your antenna was pointing when you take a measurement. You can also create and display measurement labels.
Application SV28 enables the following LTE base station transmitter measurements:
- Cell ID
- Channel Power
- Occupied Bandwidth
- Adjacent Channel Leakage Ratio (ACLR)
- Spectrum Emission Mask (SEM)
- Transmitter Off Power for TDD
- Reference Signal (RS) Power
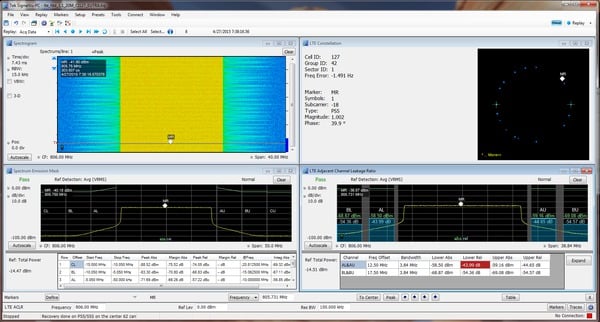
There are four presets to accelerate pre-compliance testing and determine the Cell ID. These presets are defined as Cell ID, ACLR, SEM, Channel Power and TDD Toff Power. The measurements follow the definition in 3GPP TS Version 12.5 and support all base station categories, including picocells and femtocells. Pass/Fail information is reported and all channel bandwidths are supported.
The Cell ID preset displays the Primary Synchronization Signal (PSS) and the Secondary Synchronization Signal (SSS) in a Constellation diagram. It also provides Frequency Error.
The ACLR preset measures the E-UTRA and the UTRA adjacent channels, with different chip rates for UTRA. ACLR also supports Noise Correction based on the noise measured when there is no input. Both ACLR and SEM will operate in swept mode (default) or in faster single acquisition (real-time) when the measurement bandwidth required is less than 40 MHz.
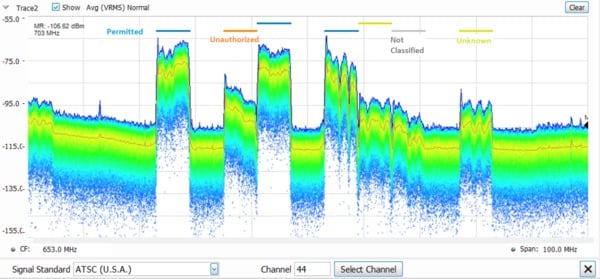
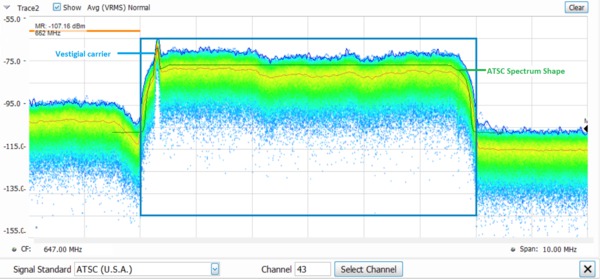
The signal classification application (SV54) enables expert systems guidance to aid the user in classifying signals. It provides graphical tools that allow you to quickly create a spectral region of interest, enabling you to classify and sort signals efficiently. The spectral profile mask, when overlaid on top of a trace, provides signal shape guidance, while frequency, bandwidth, channel number, and location are displayed allowing for quick checks. WLAN, GSM, W-CDMA, CDMA, Bluetooth standard and enhanced data rate, LTE FDD and TDD, and ATSC signals can be quickly and simply classified. Databases can be imported from your H500/RSA2500 signal database library for easy transition to the new software base.
SignalVu-PC with mapping can be used to manually indicate the azimuth of a measurement made in the field, greatly aiding in triangulation efforts. The addition of a smart antenna able to report its direction to SignalVu-PC automates this process. Automatically plotting the azimuth/bearing of a measurement during interference hunting can greatly speed the time spent searching for the source of interference. Tektronix offers the Alaris DF-A0047 handheld direction finding antenna with frequency coverage from 20 MHz -8.5 GHz (optional 9 kHz-20 MHz) as part of a complete interference hunting solution. Azimuth information and the selected measurement is automatically recorded on the SignalVu-PC Map just by releasing the control button on the antenna. Full specifications for the DF-A0047 antenna are available in a separate antenna datasheet available on www.Tektronix.com.
Playback of recorded signals can reduce hours of watching and waiting for a spectral violation to minutes at your desk reviewing recorded data. Recording length is limited only by storage media size and recording is a basic feature included in SignalVu-PC. SignalVu-PC application SV56 Playback allows for complete analysis by all SignalVu-PC measurements, including DPX Spectrogram. Minimum signal duration specifications are maintained during playback. AM/FM audio demodulation can be performed. Variable span, resolution bandwidth, analysis length, and bandwidth are all available. Frequency mask testing can be performed on recorded signals up to 40 MHz in span, with actions on mask violation including beep, stop, save trace, save picture, and save data. Portions of the playback can be selected and looped for repeat examination of signals of interest. Playback can be skip-free, or time gaps can be inserted to reduce review time. A Live Rate playback ensures fidelity of AM/FM demodulation and provides a 1:1 playback vs. actual time. Clock time of the recording is displayed in the spectrogram markers for correlation to real world events. In the illustration below, the FM band is being replayed, with a mask applied to detect spectral violations, simultaneous with listening to the FM signal at the center frequency of 92.3 MHz.
Instrument controller for USB spectrum analyzers
For field operations, a complete solution requires a Windows Tablet or laptop for instrument operation, record keeping and communication. Tektronix recommends the Panasonic FZ-G1 tablet computer for controlling the RSA306B and as a standalone unit.
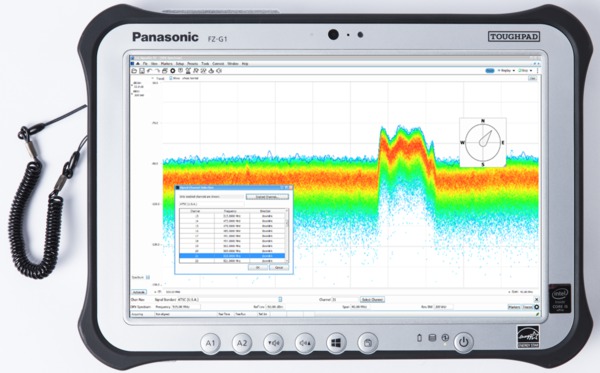
The Panasonic FZ-G1 tablet computer is sold separately and is available for purchase from Panasonic at https://na.panasonic.com/us/computers-tablets-handhelds/tablets/tablets/toughpad-fz-g1 and a variety of third party vendors. Tektronix recommends the FZ-G1 over other tablets because of its performance, portability, and ruggedized form-factor and it has been tested to work with all USB RSA products.
Key specifications of the instrument controller
- Windows 10 Pro 64-bit operating system
- Intel® Core i5-6300U vPro TM 2.4-3.0 GHz Processor
- 8GB RAM
- 256 GB Solid State Drive
- 10.1″ (25.6 cm) Daylight-readable screen
- 10-point Multi Touch+ Digitizer screen plus included pen interface
- USB 3.0 + HDMI Ports, 2nd USB Port
- Wi-Fi, Bluetooth® and 4G LTE Multi Carrier Mobile Broadband with Satellite GPS


